
Global Equites Perspective - Rosenberg Equities
- 13 August 2021 (7 min read)
- Economy and markets: Investor sentiment stays strong
- Factors: Value and momentum align
- Valuation: After a pause, investors reevaluate the value revival
- Earnings: A year into the crisis, where does analysts’ attention lie?
Economy and markets
Global stocks continued to make solid gains in the second quarter as the roll-out of COVID-19 vaccinations and further signs of economic recovery boosted investor sentiment. Growing inflationary pressures, however, dominated headlines and led to sharp declines in early May. In June, the US Federal Reserve indicated that it could start to raise interest rates sooner than expected – albeit only in 2023. This initially rattled markets, but stocks soon rallied to reach new all-time highs as investors appeared to shrug off their inflationary concerns. Worries about the pandemic also caused bouts of unease as infections spiked in several countries early in the quarter, especially India, and as the highly contagious Delta variant of COVID-19 spread around the world. With investors’ risk appetite nonetheless remaining strong, cyclical stocks and sectors led markets during the quarter, with real estate, energy – a beneficiary of higher oil prices – and technology all outperforming. Underperformance was seen in consumer-related sectors. Utilities, a typically defensive sector, also delivered weak returns over the period.
Factors
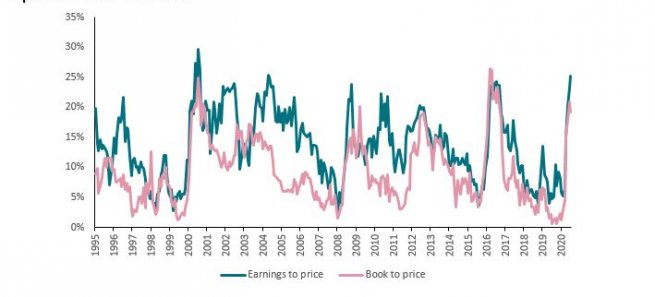
In last quarter’s Perspectives, we highlighted the unusual decoupling of two normally closely related investor-sentiment-driven investment strategies, illustrated by the paltry overlap between the top quintiles of price momentum and analyst earnings revisions. This quarter we use the same framework to report on an equally noteworthy recoupling – that of the momentum and value factors after several years of disagreement.
Value and momentum rarely see eye to eye. The highest value stocks tend to be those trading at the lowest prices relative to their fundamentals; and stocks don’t tend to remain at low prices for long if they sharply outperform their local market – which is what the momentum factor reflects. The top quintile of the book-to-price flavour of the value factor has had an average overlap of less than 10% with price momentum over the past 15 years, compared with about 14% for earnings to price. However, in both cases, there is considerable volatilility around the average: the percentage of holdings common to both the value and momentum factors has ranged from essentially zero near the tech bubble peak to a high of 30% shortly after the bubble burst. Two decades later, the relationship between value and momentum has just performed a similar U-turn. The degree of overlap between the factors has surged from a cyclical low of less than 5% late last year to 20% and 25% for book-to-price and earnings-to-price, respectively, at the end of June. These are the highest numbers since the brief value rebound after the US election in 2016.
Correlations between factors are important for investors to monitor and manage, especially when significant changes take place. The past quarter brought this into sharp relief, with several momentum ETFs forced to make wholesale adjustments – one of the largest reportedly reshuffling more than two thirds of its holdings. For investors who have grown accustomed to momentum predominantly providing access to fast-growing, but richly valued, technology stocks, this requires a shift in mindset. The MSCI World Momentum Index ended the second quarter with a forward P/E multiple of 18 (about half of its level late last year), with very different sector exposures (significantly higher exposures to the financials and energy sectors), and lower quality than in recent quarters.
Beyond exposures, it’s also worth noting the fundamental signal that these shifts in factor profile indicate. Trailing price momentum typically aligns with areas where investors perceive improving fundamental prospects. While price momentum and earnings revisions haven’t agreed on much lately, they agree on this: the overlap between value factors and forward earnings revisions also moved higher in the second quarter.
Valuation
Value’s increasing correlation with momentum is, of course, the result of its outperformance in the past year. After a particularly strong first quarter, this outperformance paused in the recent quarter, largely as a result of a sharp rotation towards growth stocks in June. The magnitude of growth’s rebound – accompanied by a reversal in some of the macroeconomic trends that had appeared to support value, such as rising interest rates and improving economic growth – led many investors to question the durability of the recent value rally.
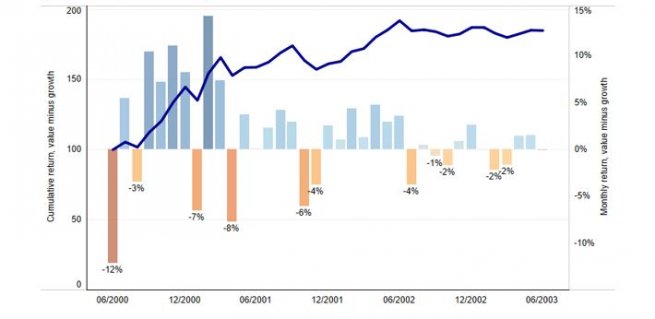
Valuation-oriented investment manager GMO entered the debate at the end of the quarter, perhaps unsurprisingly urging investors to maintain a long-term perspective, even in the face of unpleasant monthly drawdowns. Citing data for the US large cap Russell 1000 value and growth indexes – where the gap between growth and value was particularly large in June (growth outperformed by more than 7%) – they show that short-term reversals have been a common feature of past value recoveries. In fact, some of value’s weakest months occurred during the factor’s best 3-year period relative to growth. Exhibit 2 highlights this period. After underperforming its growth counterpart by 12% in June 2000, the Russell 1000 Value Index proceeded to outperform it by around 85% over the next three years (more than 20% per year). However, even this remarkable post-tech-bubble resurgence saw several months in which value strongly trailed growth. As the chart shows, the value index lagged by 3% in August 2000 (just one month into the nascent recovery), by 7% in January 2001 and by 8% three months later. In all of these cases, the short-term reversal obscured a more meaningful, and more enduring, revival.
Of course, past performance is no guarantee of future returns and there are important differences between the current market environment and the early 2000s that are sure to influence value/growth dynamics. On the other hand, there are also clear parallels between the periods that warrant consideration. The coming months will reveal the fate of the first quarter’s value recovery, but in the meantime, at the very least, this analysis illustrates the potential risks of a short-term perspective – in investing, even established paths have bumps in the road.
Earnings
Earnings announcements throughout the second quarter confirmed what higher markets have been signaling for much of the past year – a V-shaped recovery that brought profits in many areas back to pre-crisis levels. Looking beyond the numbers, however, provides some less telegraphed insights into how the world has changed since the pandemic began. Natural language processing allows us to follow the arc of investors’ and executives’ attention through analysing the words they use when they meet. In a paper The Language of a crisis we published in April last year we documented the increase in references to COVID-19 and related phrases in these interactions. A little over a year later, second-quarter earnings calls give us our first glimpse of how the conversation has shifted, in a world which is finally showing signs of progress tackling coronavirus.
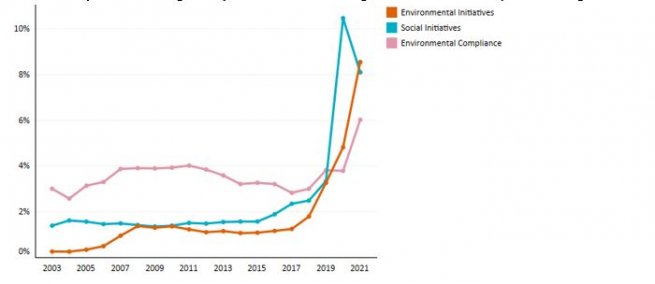
As we note in a new paper Company earnings calls a year into the crisis, direct mentions of COVID-19 and related terms have fallen significantly in the past 12 months. However, the ongoing impact of the pandemic is clear in a new set of keywords. For example, analysts’ references to “inflation” in their questions to management teams have risen sharply as governments around the world have rolled out stimulus programs to tackle the crisis and as supply chains have struggled to cope with economic reopening. From an investment perspective, one of the most notable changes is the dramatic increase in references to ESG-related topics. Not only did “ESG” appear almost six times more frequently in investors’ questions to management in the second quarter of this year than 12 months ago, but management teams also discussed ESG much more in their presentations to investors. To gain a sense of the context of managements’ mentions, we trained a machine-learning model to classify ESG-related paragraphs in documents into a selection of 12 themes. When we apply it to second-quarter earnings transcripts, we find a marked increase in the environmental and social initiatives categories, which overtook our ‘environmental compliance’ category as the biggest focus for management teams last year. Looking forward, this shift from a compliance mindset to one based on new initiatives seems to bode well for a continued focus on ESG.
Disclaimer
This document is for informational purposes only and does not constitute investment research or financial analysis relating to transactions in financial instruments as per MIF Directive (2014/65/EU), nor does it constitute on the part of AXA Investment Managers or its affiliated companies an offer to buy or sell any investments, products or services, and should not be considered as solicitation or investment, legal or tax advice, a recommendation for an investment strategy or a personalized recommendation to buy or sell securities.
It has been established on the basis of data, projections, forecasts, anticipations and hypothesis which are subjective. Its analysis and conclusions are the expression of an opinion, based on available data at a specific date.
All information in this document is established on data made public by official providers of economic and market statistics. AXA Investment Managers disclaims any and all liability relating to a decision based on or for reliance on this document. All exhibits included in this document, unless stated otherwise, are as of the publication date of this document.
Furthermore, due to the subjective nature of these opinions and analysis, these data, projections, forecasts, anticipations, hypothesis, etc. are not necessary used or followed by AXA IM’s portfolio management teams or its affiliates, who may act based on their own opinions. Any reproduction of this information, in whole or in part is, unless otherwise authorised by AXA IM, prohibited.
Risk Warning
The value of investments, and the income from them, can fall as well as rise and investors may not get back the amount originally invested.